XLE Energy SPDR
I picked up a few shares of XLE yesterday. I figured it was beaten down enough and should revert back to the mean, hopefully around $60. Update: Now sold…
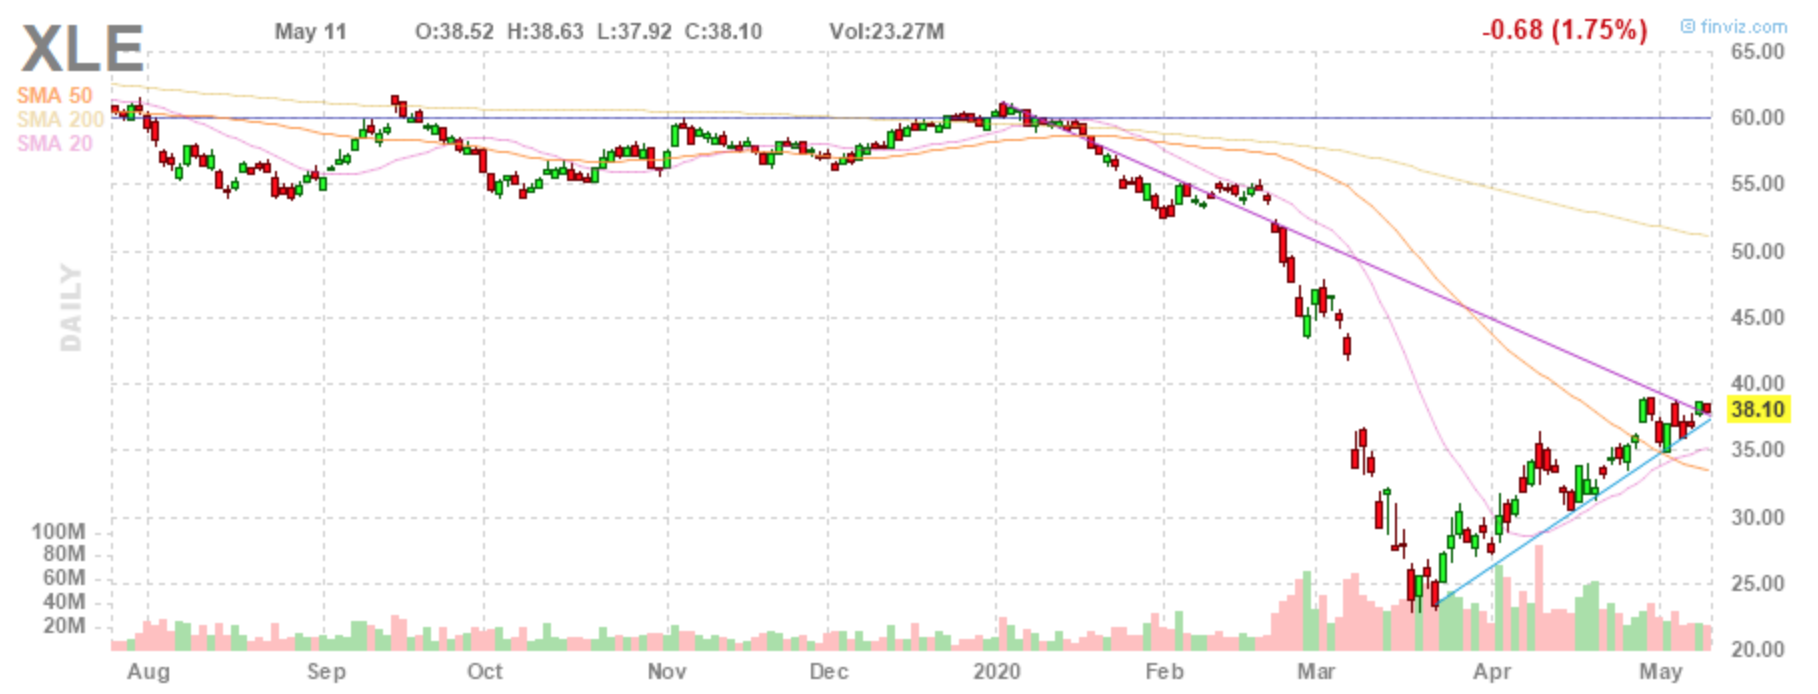 XLE, Energy ETF
Chart wise I see two things happening. First, I see a window was opened when XLE fell off the cliff in March. I should probably do the statistics on it but the general wisdom is that eventually this window would be shut. If that’s to be believed then the price for XLE should rise ~ $43/share in time.
The second thing chart-wise is price coiling, meaning the prices will either break higher or lower. When will this happen? Who knows? Technical Analysis is always Voodoo.
Why is it perceived that Technical Analysis seems to work? My ‘gut’ tells me it’s because of confirmation bias. Every trader or investor is looking at the same charts, trying to find some pattern to help them explain price movements. Then they all trade around these perceived patterns and the ‘patterns’ are confirmed.
Me? It’s good to keep an eye on what the masses are doing but I try to take a holistic approach to things. Supply and demand work, innovation drives new alpha, and markets change. The world will need energy and if it’s on sale, it’s probably a good idea to buy some with limited risk.
I always dip my toe into the market after massive selloffs. You never know if the volatility will continue or not, so it pays to be cautious. I prefer either ETF’s or mutual funds these I usually use limit orders to enter a position and stop losses to set my level of risk.
Disclosure: No positions