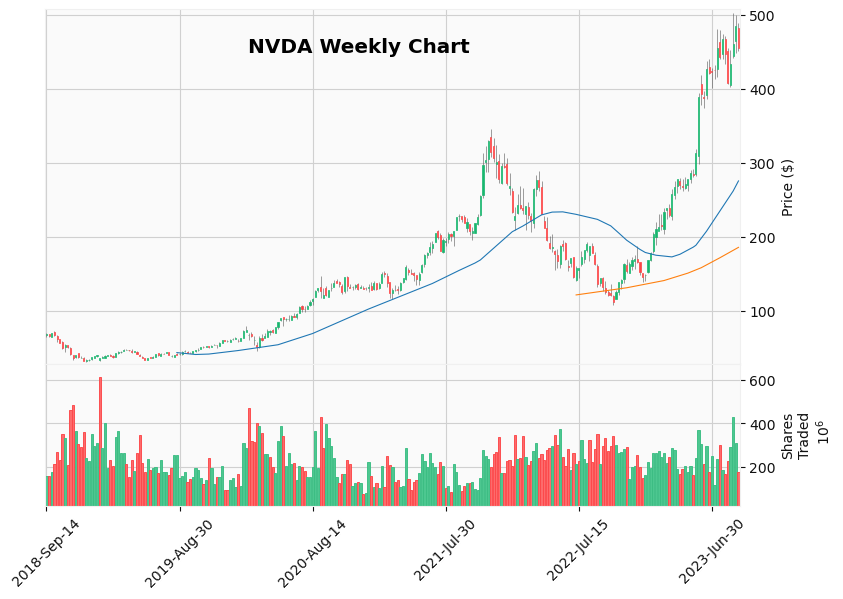
Weekly NVDA Price Chart
Yeah here’s a weekly chart of NVDA. You can see it’s still in an upward trajectory although the last few weeks have been very volatile. I made a good chunk of taxable profit on this one because I was trend following and got stopped out after a few months.
Ideally I’d like to have ridden NVDA’s trend for over a year but the market does what the market wants to do and I’m just grateful to have doubled my investment.
 Weekly NVDA price chart