Gold & Silver Market Report for Dec 19, 2020
It’s Saturday, December 19, 2020 and this is your week’s Gold and Silver market report. In a stunning reversal, Gold and Silver prices closed higher this week. While this is good news, the charts are showing that Gold is making ’lower highs, and ‘lower lows’ on the weekly charts and Silver appears to be in a range.
Still, this up movement was welcome news for the Silverbugs who are hoping for a $30/oz Christmas. Gold closed at $1,885.69, up 2.49% for the week, where Silver closed at $25.94, up 7.94%!
Gold Chart
Gold had a strong week with Bulls breaking through last week’s long legged dojo and charging higher. Last week’s model’s predicted a lower close but Gold Bulls wanted to end the year on a strong note. Our models show that this week’s action was strong enough to affect the downward price trend by creating a temporary pause.
It remains to be seen if Bulls will come charging out of the gate to higher prices in 2021. Right now, our models are predicting a higher close for Gold next week to the $1,839 level. However, the risk to the downside remains and it is quite possible that Gold could end the year closer to the $1,800 level than the $1,900 level.
Silver Chart
Silver had a volatile week as Silverbugs continue to buy at these levels. The long legged dojo from the week before was broken as Bulls took control but failed to break through the $26 level. Silverbugs are eyeing the $30 level to either start selling trapped positions or confirm that their purchases at the $23 to $25 level was a wise buy. Expect more volatility this week.
Just as Gold above, this week’s price action was enough to create a temporary pause on the downward price trend and our models are pointing to a flat close for Silver next week to the $25.92 level. Our models show that the current price level for Silver is where it supposed to be, anything above it is too pricey and anything below it is at value.
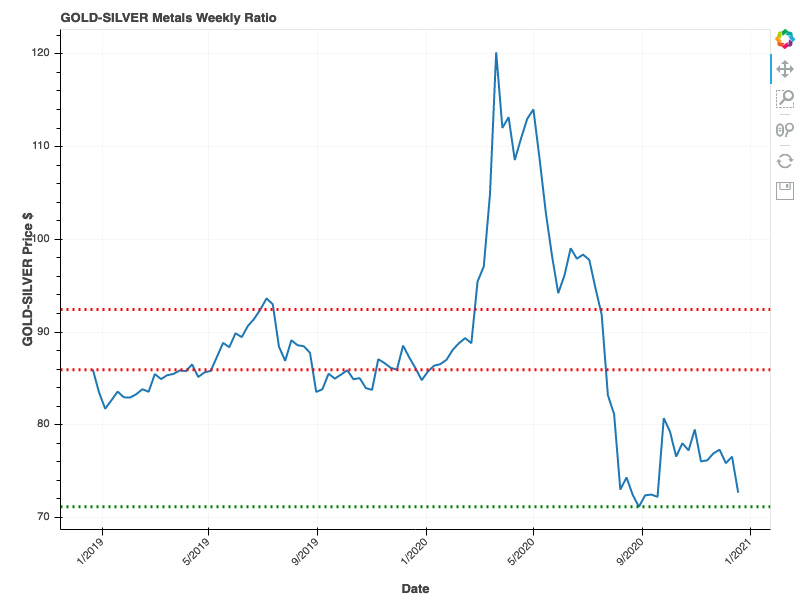
Gold to Silver Ratio Chart
The Gold to Silver Ratio closed higher to the 72.66 level, a touch higher from last week’s close. Last week’s strong Gold and Silver action kept this ratio pretty flat and our models appear to be transitioning to another state with initial results are showing the Gold to Silver ratio could move lower in the new year. However, our models forecasting a slight higher close to 76.82 for next week indicating that Silver might be heading lower. This is at odds with our Silver forecast above.
 Gold to Silver Ratio Chart