Gold & Silver Market Report for Dec 12, 2020
It’s Saturday, December 12, 2020 and this is your week’s Gold and Silver market report. Gold and Silver prices closed mixed this week with Gold edging out a slight gain and Silver closing a touch lower. Both prices experienced very volatile price swings throughout the week with Gold closing to $1,839.80 (+0.02%) and Silver to $24.03 (-0.07%).
Gold Chart
Gold had a very volatile week as is evident by the long legged doji of this week’s price action. This signals market consolidation or general indecision at which way prices should move. Our models point to downward price pressures and our forecast for Gold next week is a lower close to the $1,829.05 level. It’s quite possible that Gold could end the year closer to the $1,800 level than the $2,000 level. Long term forecasts for Gold point to higher prices but with larger price swings in the short term.
Silver Chart
Silver had less volatile week and closed slightly lower overall. It was forming a long legged doji candle before it broke prices broke to the lower side. Our models point to more downward pressure and we forecast a near flat close for next week with Silver prices predicted to be around the $24.08 level. The long term price forecast for Silver is mixed, we see a sustained downward move for Silver prices to the $22 level and possibly even to the $18 level before moving higher again.
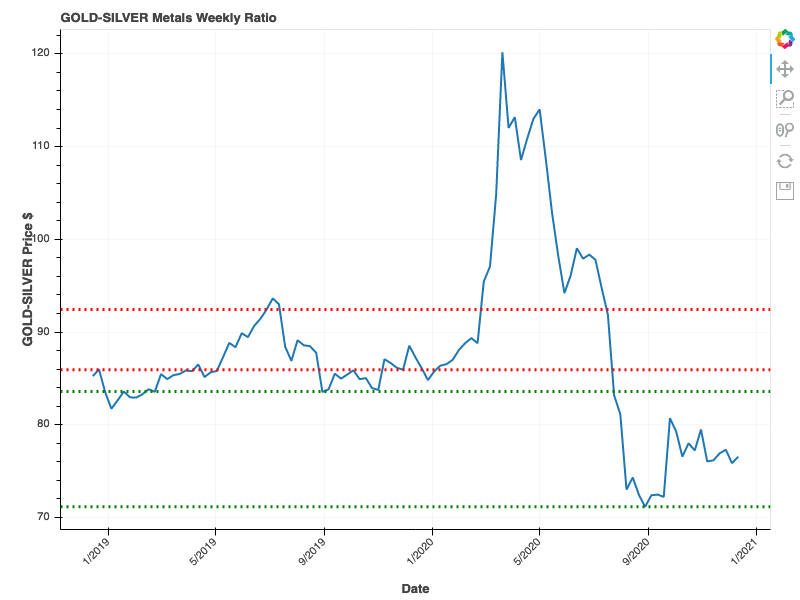
Gold to Silver Ratio Chart
The Gold to Silver Ratio closed higher to the 76.50 level. We expect this number to move higher in the coming weeks as Silver faces downward price pressures. Our models forecast a slightly lower close to 76.38 for next week.
 Gold to Silver Ratio Chart