Gold & Silver Market Report for Oct 31, 2020
It’s Saturday, October 31, 2020, and this is your week’s gold and silver market report.
Gold and Silver closed lower this week with a loss of -1.29% and -4.10% to $1,877.40 and $23.61 respectively. Both metals have failed to take out previous highs and the bearish candle from 5 weeks ago appears to have been a turning point in both of the metals uptrend. All uptrends are weakening which could mean more downward price pressure in the coming weeks and months.
We expect next week to be very volatile for both metals because of the US elections.
Gold Chart
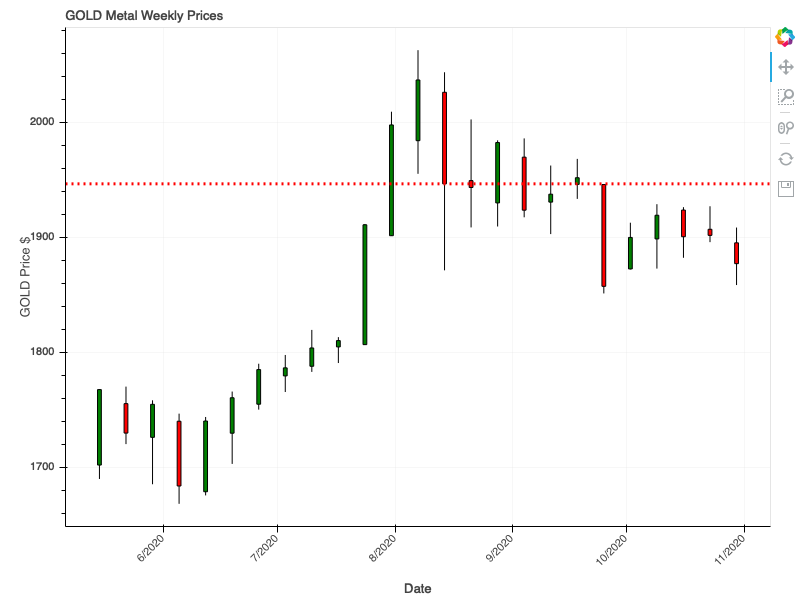 Weekly Gold Support and Resistance Chart
Gold had a wild ride this week with it closing lower as our models have forecasted. The risk for a downward price thrust to the $1,800 range is increasing, the technical outlook for Gold prices in the short term is to trend lower. Our models are showing a weakening of the uptrend momentum and forecast Gold to close lower to $1,866.83.
Silver Chart
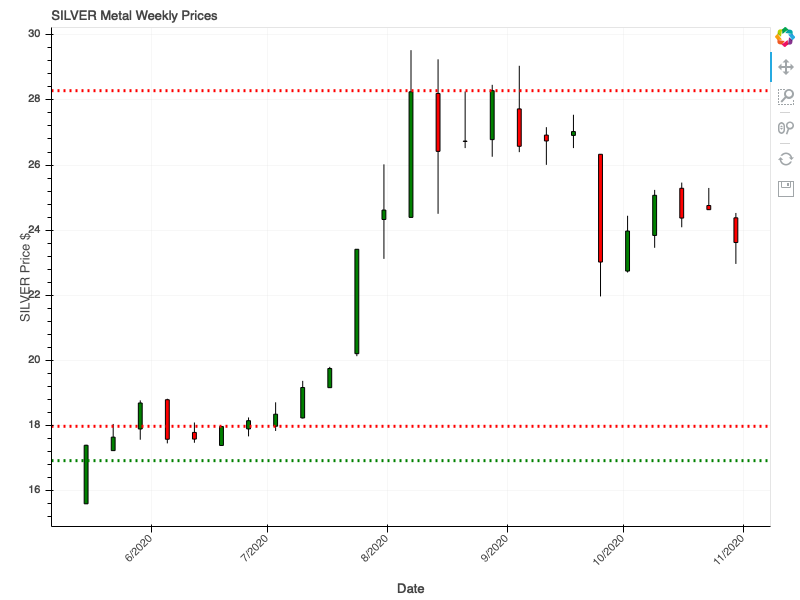 Weekly Silver Support and Resistance Chart
Silver had another volatile week and closed lower as our model forecasted. The risk for Silver prices to hit the $17 to $18 range is increasing and our models forecast a lower close for Silver next to $23.55. We believe that Silver will become very volatile in the next few weeks and prices are expected to head lower from here. Just as with the Gold model, the uptrend in Silver is weakening and we expect a flush out of weak hands between now and the end of November.
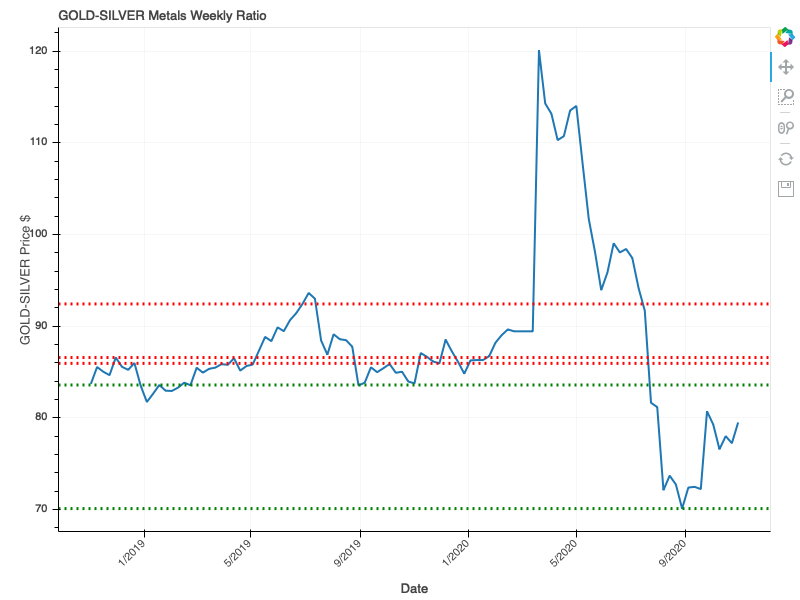
Gold to Silver Ratio Chart
 Weekly Silver Support and Resistance Chart
The Gold to Silver ratio closed higher to 79.49 as predicted by our models. This was due to price volatility in both Gold and Silver, with Silver taking a bit hit on a percentage basis. Our models are forecasting a lower ratio to 78.08 which hints at possible more Gold selloff or Silver prices stabilizing next week, which is at odds with our Silver price predictions for next week.
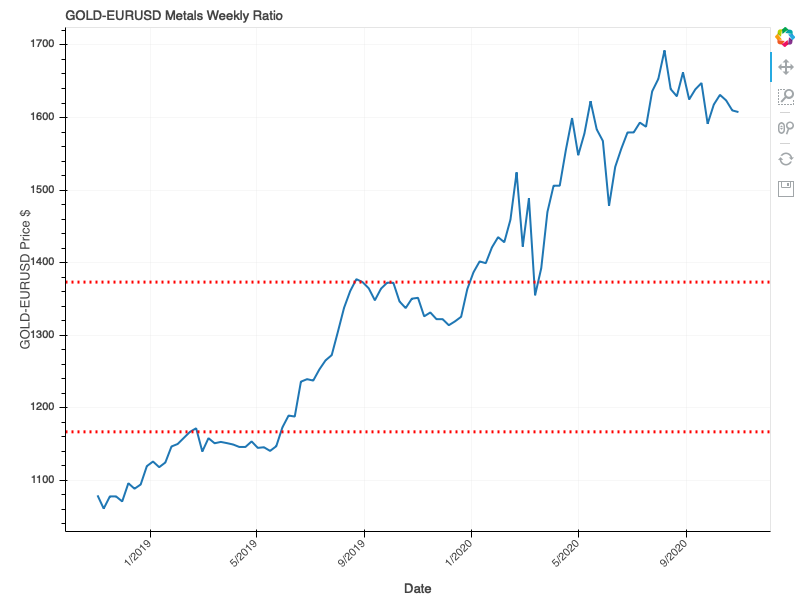
Gold to EURUSD Ratio Chart
 Weekly Silver Support and Resistance Chart
Last week we forecasted the Gold to EURUSD ratio to close higher to the 1,637.03 level but instead, it closed lower for the week to 1607.54. This hinted at a stronger Euro relative to the USD, which is good news for Gold prices. The models are forecasting a higher close to this ratio to 1626.42, which points to a possible higher dollar. The ratio forecasts are at odds with the technical patterns and model forecasts for Gold and Silver prices.
This is to be expected when money abruptly flows from one asset to the other in anticipation of large geopolitical events, such as the US election.
A scenario that we feel might happen is this: Gold and Silver prices will drop as speculators sell positions and convert proceeds into USD. The Gold to Silver ratio should rise above 80 as Silver will be the first to sell off, putting upward pressure on that ratio. Next, the selloff in metals might indicate a rush to buy other assets such as Stocks and push the USD down lower as more USD is chasing assets and push the stock market higher. This would put more downward pressure on the EURUSD prices lower the Gold to EURUSD ratio further.