A Leading Indicator of a Stock Market Crash
For all the jawboning that the JPOW and the Federal Reserve are saying about we’ll beat a recession in the face of rising interest rates, a leading indicator is telling us something completely different. The leading indicator of a stock market crash that I always keep a lazy eye on is the 10-year and 2-year Treasury Bill interest rate spread. When that spread dips below zero we’re flashing a big warning.
We’ve all heard the phrase, the yield curve has inverted! Every talking head on TV, radio, or on this blog will start freaking out. Why? Because when the short-term Treasury rates (e.g. 1-year, 2-year) are higher than the longer-term ones (e.g. 10-year, 30-year), it signals that market participants are pricing in a recession/market crash and moving money into short-term assets.
Essentially they’re taking profit, safeguarding their wealth, and preparing to buy assets more cheaply in the future.
Don’t believe me? Here’s a handy chart of the past 20 years from the St. Louis Fed.
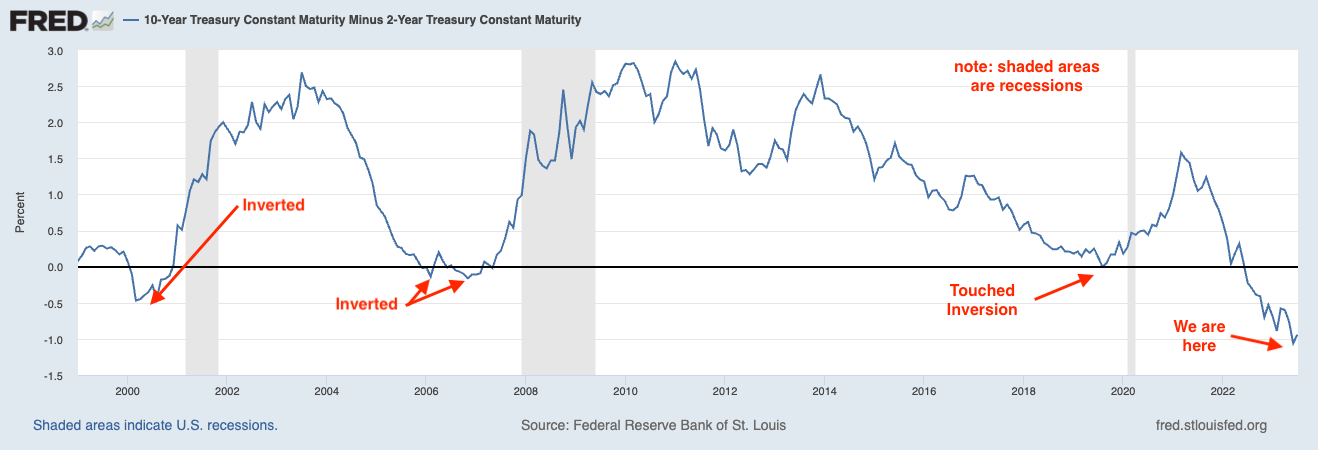 10 year and 2 year inversion
The chart above is the difference between the 10-year Treasury Bill interest rate and the 2-year Treasury Bill interest rate. When the difference between the two assets touches or goes below zero, then the yields have inverted. The term “flattening” is used as the move toward zero.
Now we don’t enter a recession the moment the yield curve inverts, there’s a delay between the inversion and the actual recession. No one knows when it will happen but it could be 12 to 24 months in the future. The wild card is when the recession will happen.
You’ll see this pattern emerge in a longer view as well, all the way to the 70s.
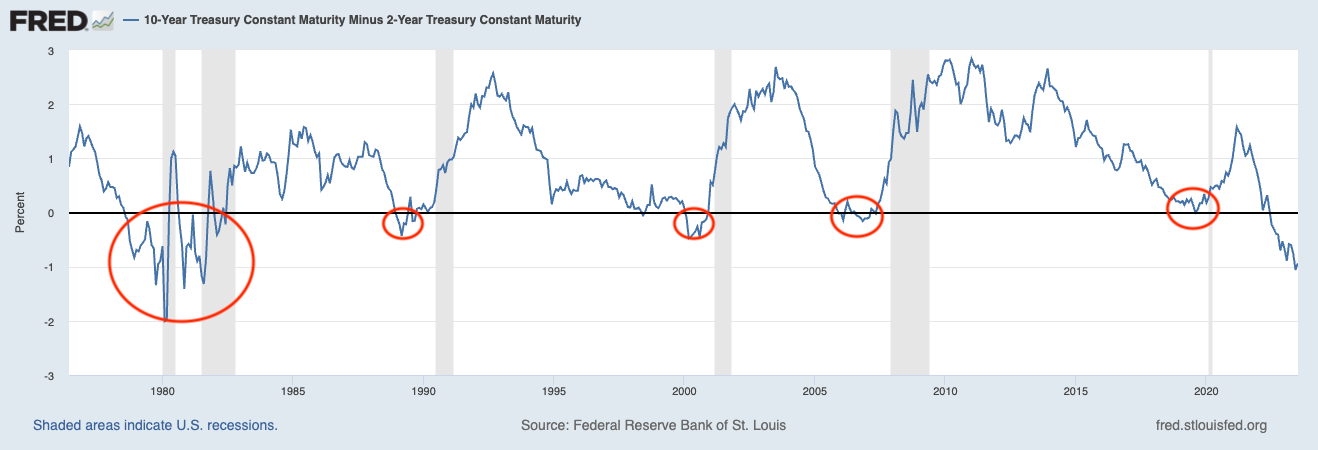 10 year and 2 year inversion longer timeframe
Granted, this indicator only foreshadowed the last 10 recessions, with the COVID pandemic possibly being the truly random event that caused a recession. Yet in the case of the COVID pandemic, the 10-year/2-year difference started to flatten, it never inverted.
What does this mean for today? Lots.
The current difference between the two rates is very steep. Just before the July 4th holiday, the difference was -1.08. It’s eased back a bit, but in terms of Treasury Bills and the bond market, that’s a lot.
I believe we’re heading for another recession and a big one, perhaps on par with the 2007-2008 one. I believe that the Federal Reserve will overshoot with its interest rate hikes. JPOW is expected to raise rates another 0.25% in July and at some point, it’ll break the market. Perhaps just in time for the September/October volatility.
I also believe that the interest rate hikes will eventually flush out weak hands in the real estate market, that’s good news for the average home buyer. The hedge funds and real estate investors are trying to keep prices high but the peak price for Median House Sales was $479,500 in September 2022 and will likely be lower in Q2 of 2023 than it was in Q1 of 2023 ($436,800).
Get ready friends, we’re going to be in for a wild ride!